New graph look and feel for Investor slide deck
¿Quieres ganar un trabajo como este?
Este cliente recibió 13 diseños de PowerPoint de 4 diseñadores. Eligieron este diseño de PowerPoint de Imazing como el diseño ganador.
Únete gratis Encuentra trabajos de diseño- Garantía
-
 NZ$150
-
 13 diseños
-
 4 diseñadores
Resumen de Diseño de PowerPoint
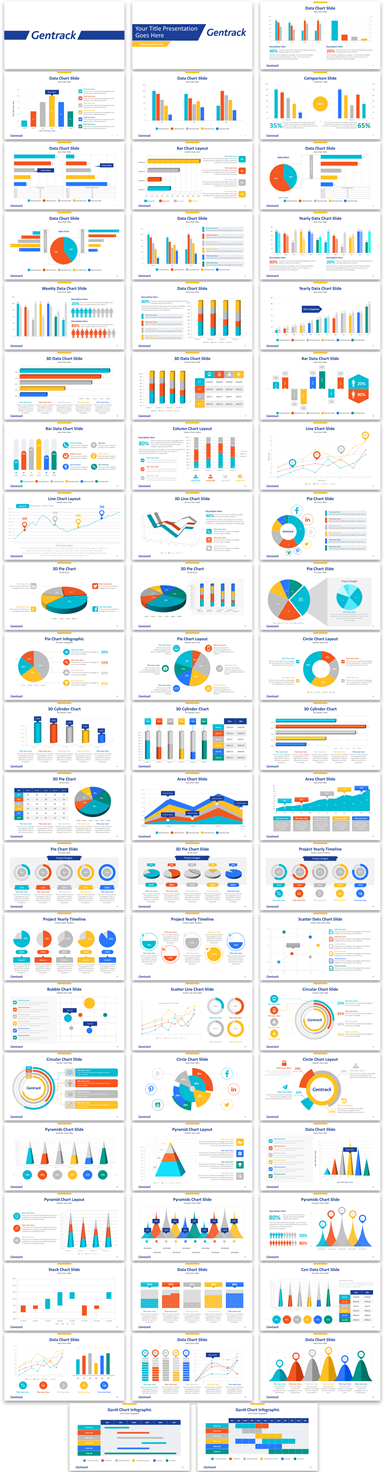
Gentrack is currently building a slide deck for its upcoming investor roadshow. This deck include a number of key business metrics - predominantly financial metrics like revenue, profit, % growth and headcount #. See gentrack.com for an idea of the current graphs used in our Investor presentations.
We are now looking for a major refresh of the look and feel of our graphs used in the investor slide deck. They need to be modern and warm. Not just something out of Excel. Presenting revenue and profit figures in $. A suite of bar charts, pie charts and line graphs for use in ppt would be superb.
Objetivo del mercado(s)
Investment analysts and advisors
Investors
Tipo de industria / entidad
Business Software
Estilos de fuente para usar
Colores
Diseñador para elegir los colores que se utilizarán en el diseño.
Mira y siente
Cada control deslizante ilustra las características de la marca del cliente y el estilo que debe comunicar el diseño de tu logotipo.
Elegante
Atrevido
Juguetón
Serio
Tradicional
Moderno
Atractivo
Profesional
Femenino
Masculino
Vistoso
Conservador
Económico
De Alta Gama
Requisitos
Debes tener
- Options for bar, line and pie graphs. Also use of bar and lines in a single graph.
- Slides should have a white to minimise print resources for investors and analysts shluld they print the slide deck.
Agradable de tener
- Warm colours. Modern look and feel. Alignment with tech look and feel
- We provide software for utilities and airports.
No debería tener
- Avoid excel graph look and feel.