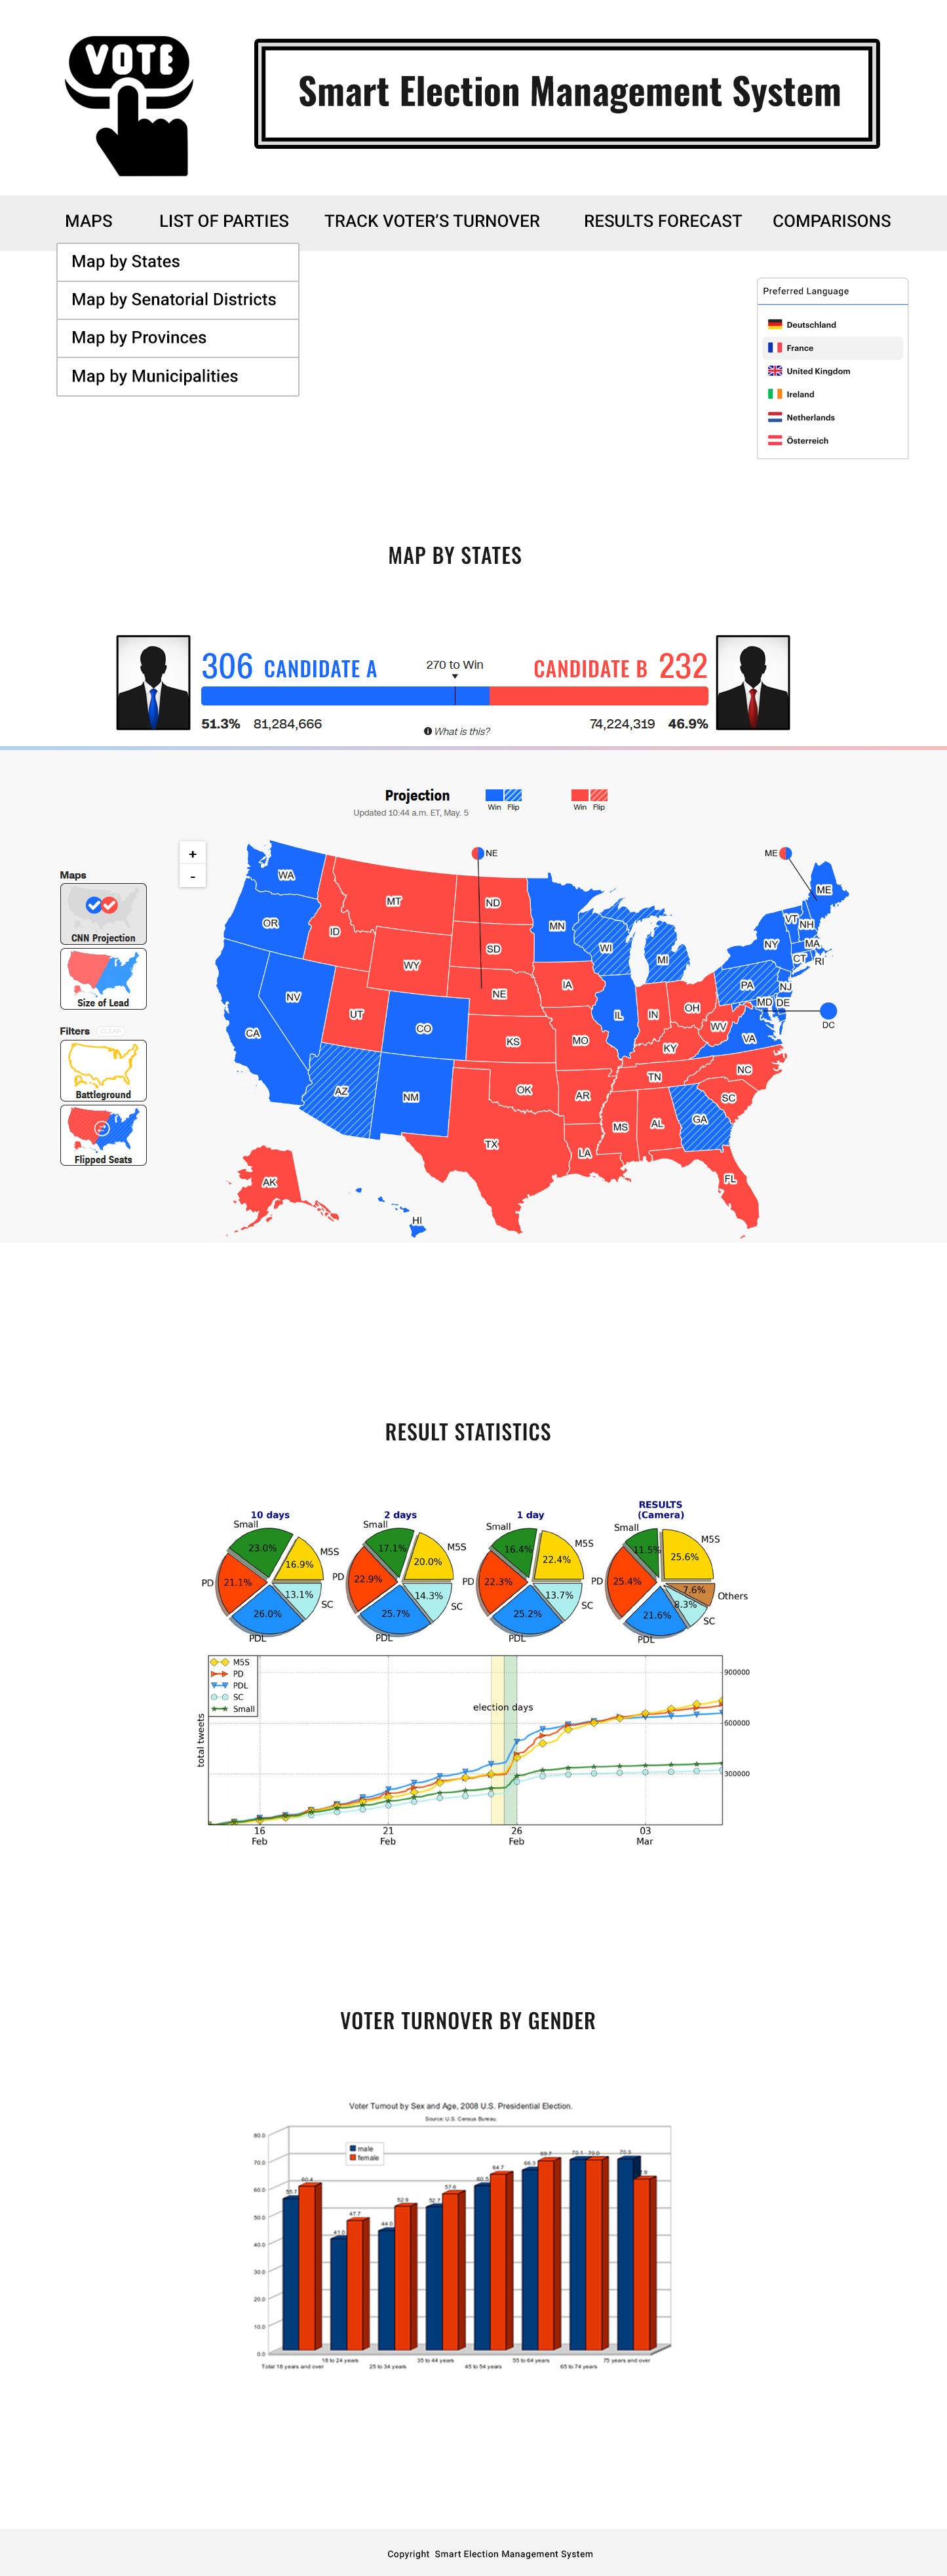
Smart Election Management System
¿Quieres ganar un trabajo como este?
Este cliente recibió 10 diseños web de 2 diseñadores. Eligieron este diseño web de M79 como el diseño ganador.
Únete gratis Encuentra trabajos de diseño- Garantía
-
 US$140
-
 10 diseños
-
 2 diseñadores
Resumen de Diseño Web
At this point, ensuring the designers understand the project scope is essential for us. Thus, a web design for an interactive prototype system. Users should be able to navigate through the system to review political election results on a dashboard. The system should provide at least the following options:
President (Maps by states or provinces, and municipalities)
Senate (Map by senatorial districts)
House (Map by representative districts)
Governor (Maps by states or provinces and municipalities)
Mayor (Maps by municipalities)
Each option should display its dashboard, including a map with election results, election results forecast, turnover stats, and related graphics.
These specifications provide a comprehensive outline for developing an interactive country map system that allows users to explore election statistics, including voter turnovers, results, and forecasts. It includes country and language selection, configuration options for political parties, dashboards, previous election comparisons, turnover election day timeline, and data collection screens.
1. Country and Language Selection:
o The system should allow users to select a country from the American continent, including Caribbean countries.
o Provide options for the preferred language (Spanish, English, and Portuguese).
o Dynamically adjust the content and language based on the user's selection.
2. Interactive Map:
o Include an interactive map of the selected country.
o Users can explore election statistics by region, province, or other administrative divisions.
o Allow users to click on a region or division to view specific election statistics for that area.
3. Configuration Screen:
o Provide a configuration screen accessible to administrators for setting up the system.
o Allow administrators to define up to 5 political parties:
Fields to specify the party's acronym or short name, symbol, and color for visual representation.
Include fields to define the party's full name and an event description (e.g., General Election, Primary Election, etc.).
o Save the configuration settings to ensure consistency across the system.
4. Dashboard Navigation:
o Implement a user-friendly dashboard for easy navigation and access to different election races and statistics.
o Include clear menus or tabs to select the desired race (presidential, congress, or mayor) and related statistics.
5. Voter Turnover Statistics:
o Display visualizations and metrics for tracking voter turnovers:
Total voter turnover for the current election.
Breakdowns of voter turnovers by gender, age, and party affiliation.
Comparison of voter turnovers between the previous election and the current election.
Turnover election day timeline by hours, showing the number of votes cast at different times throughout the election day.
6. Election Results:
o Show election results for different races: presidential, congress, and mayor.
o Provide visualizations and metrics for the following:
Total votes by political party or candidate.
Comparison of previous election results and current election results.
Election results timeline, demonstrating the progression of results over time.
7. Election Result Forecasts:
o Provide forecasted election results for each race.
o Display visualizations and metrics for the following:
Total votes by political party or candidate in the presidential, congress, and mayoral races.
Allow users to explore different scenarios or predictions based on available data.
8. Previous Elections Comparison:
o Include a section comparing the current election's statistics with previous elections.
o Display visualizations and metrics to demonstrate changes in voter turnovers, results, and other relevant metrics.
9. Turnout Data Collection Screens:
o Develop data collection screens for gathering information at polling places.
o Design intuitive and user-friendly interfaces for collecting voter turnout data, including age, gender, and party affiliation.
Objetivo del mercado(s)
Political parties, press
Tipo de industria / entidad
Political campaigns
Número de páginas requeridas
5+ page
Mira y siente
Cada control deslizante ilustra las características de la marca del cliente y el estilo que debe comunicar el diseño de tu logotipo.
Elegante
Atrevido
Juguetón
Serio
Tradicional
Moderno
Atractivo
Profesional
Femenino
Masculino
Vistoso
Conservador
Económico
De Alta Gama
Requisitos
Debes tener
- Interactive funcionality