Illustrate a statistic and its significance
¿Quieres ganar un trabajo como este?
Este cliente recibió 17 diseños gráficos de 8 diseñadores. Eligieron este diseño gráfico de Creative Jalwa como el diseño ganador.
Únete gratis Encuentra trabajos de diseño- Garantía
-
 US$300
-
 17 diseños
-
 8 diseñadores
Resumen de Diseño Gráfico
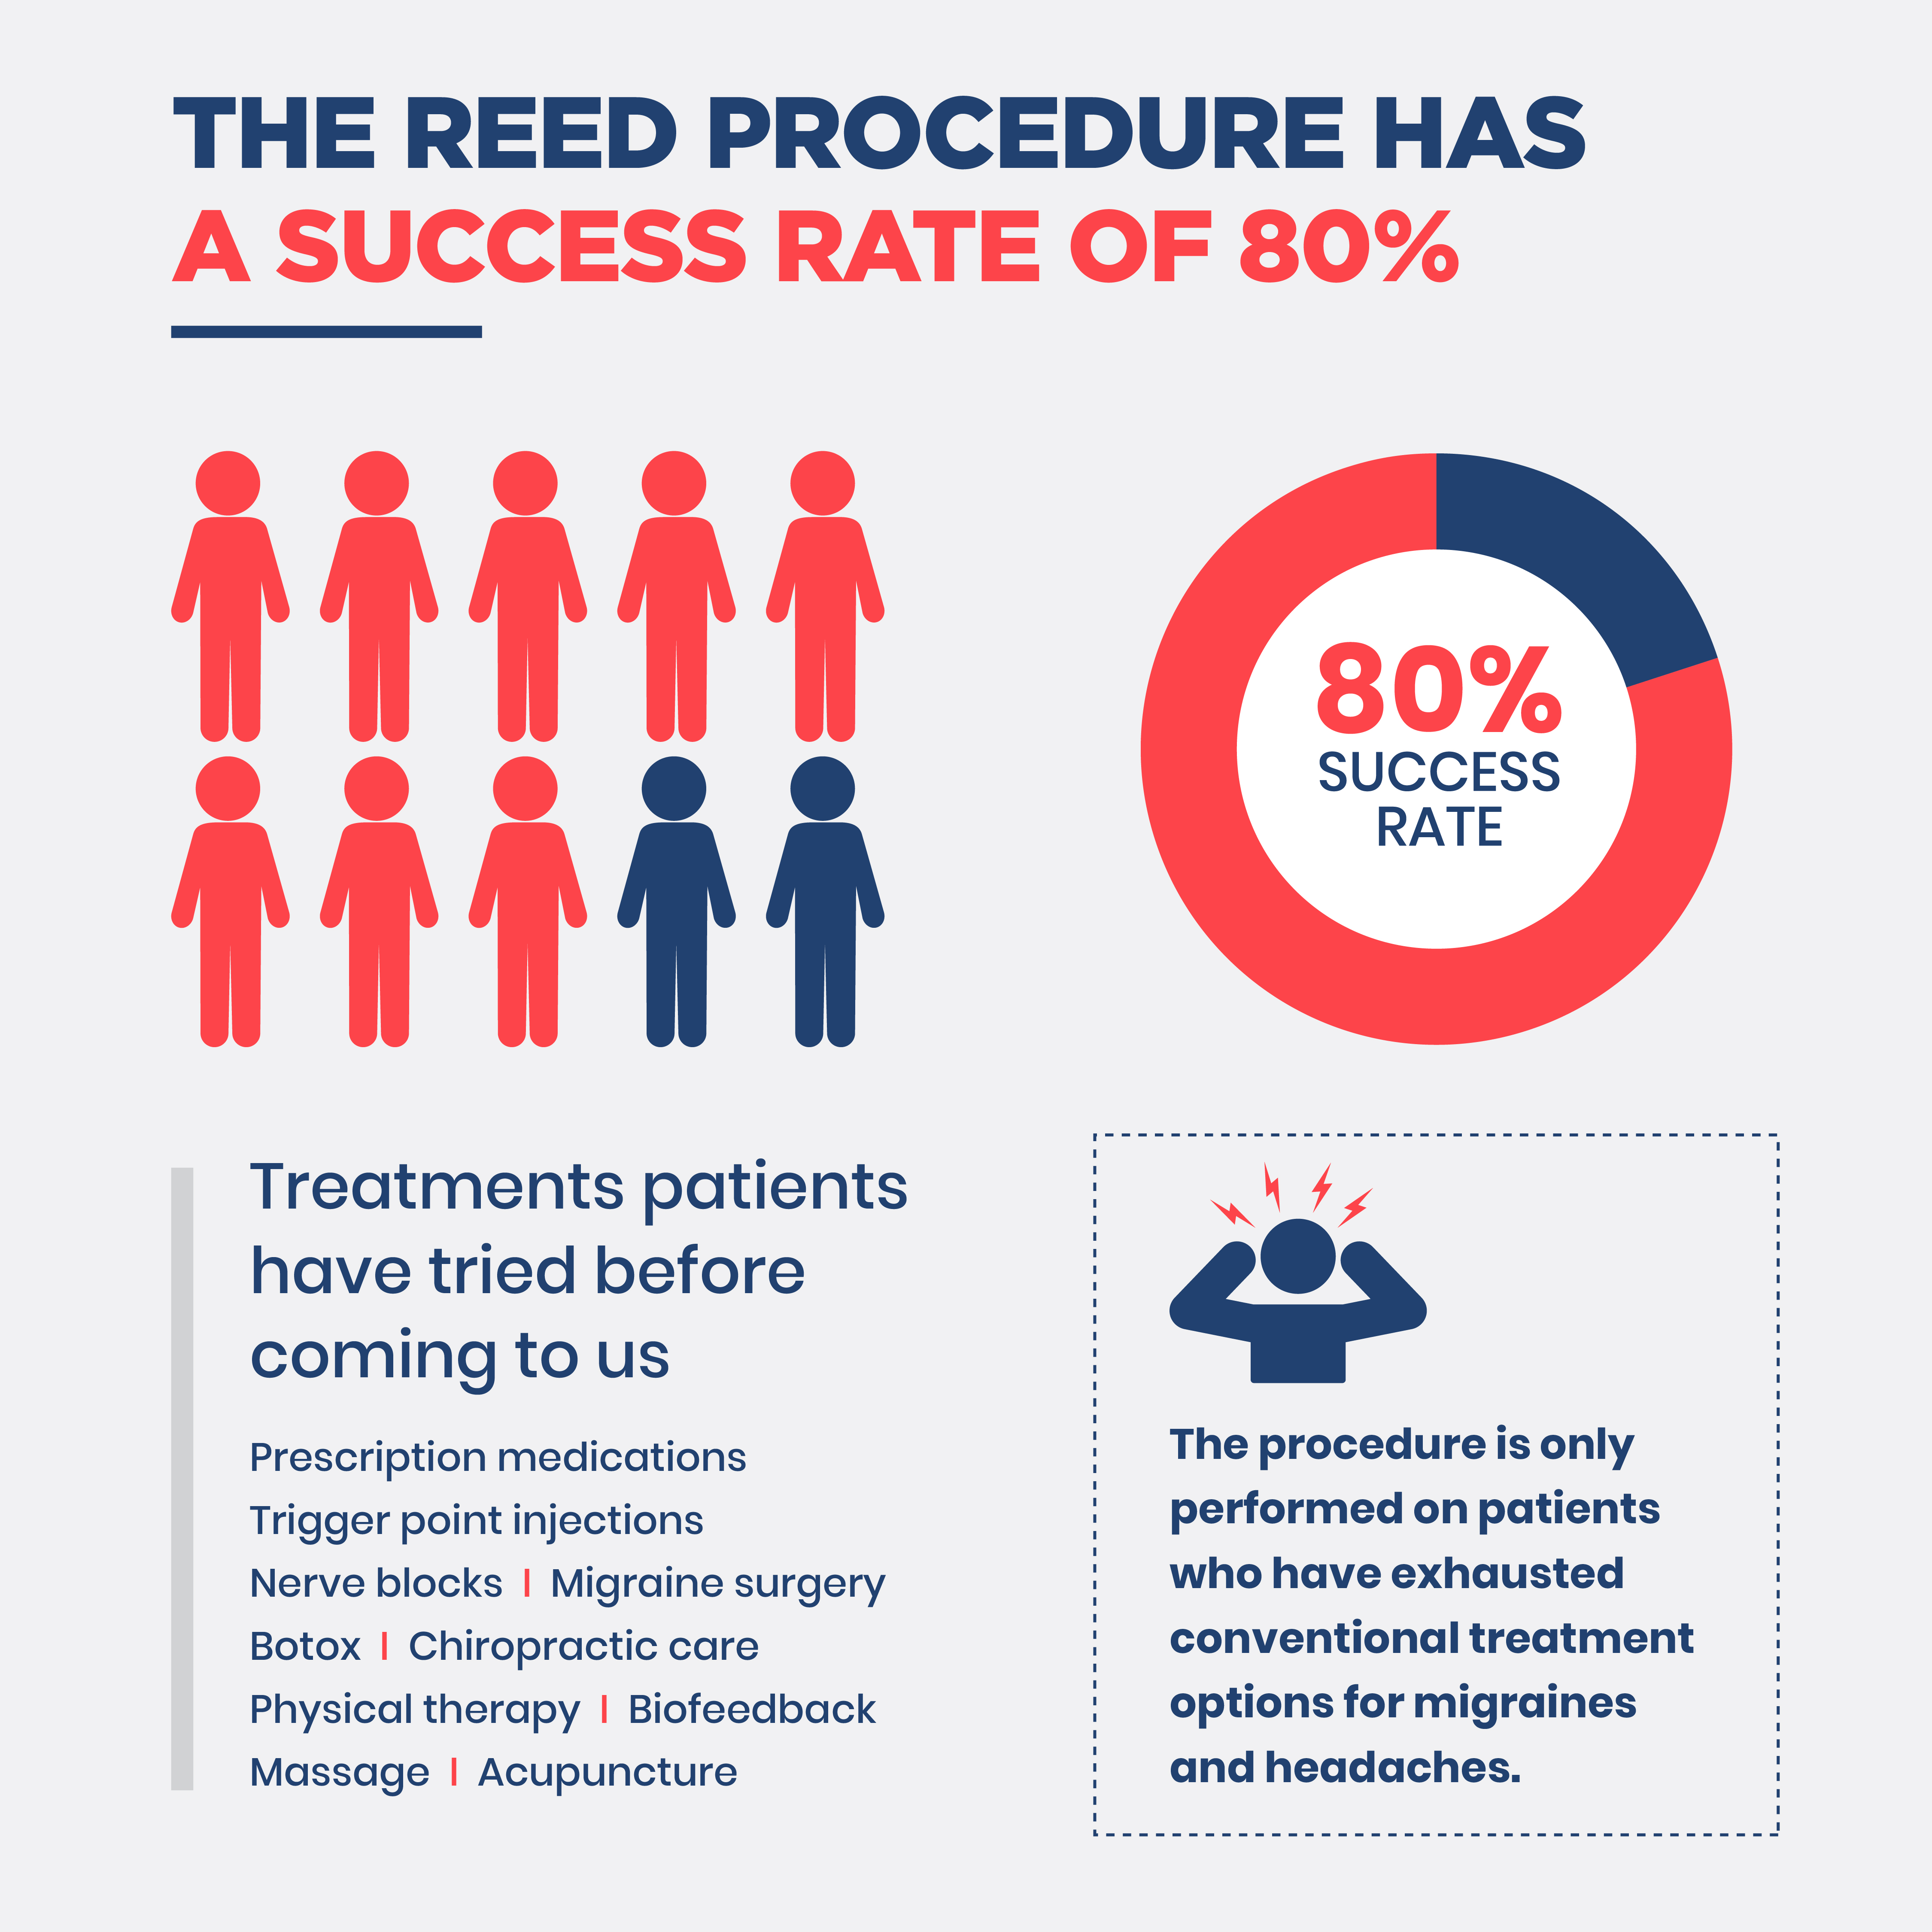
Please create a graphical representation of the success rate of the Reed Procedure for our website. The Reed Procedure has a success rate of 80%. This means the procedure is successful for 8 out of every 10 people. An 80% success rate by itself is great. However, it's even more impressive when you consider that the only people we perform this procedure on are patients who have exhausted conventional treatment options for migraines and headaches. I would really like to emphasize both the success rate and the type of patients we are successful in treating with this procedure.
For example, you could create an illustration of outlines of 10 people with 8 of them shaded in, which would represent an 80% success rate. Then, underneath this image, you could add a bullet list of the types of treatments patients (such as the 10 figures in the image) have tried before coming to us/having this procedure, which include the following:
Prescription medications
Trigger point injections
Nerve blocks
Migraine surgery
Botox
Chiropractic care
Physical therapy
Biofeedback
Massage
Acupuncture
Or maybe there is another/better way to represent this statistic graphically? I'm just looking for an effective illustration of this important statistic and its significance.
Our brand colors are red (#fd444a) and blue (#214170)
Thank you!
Objetivo del mercado(s)
People who suffer from chronic migraines and headaches
Tipo de industria / entidad
Healthcare/Medical
Estilos de fuente para usar
Gustan otros estilos de fuente:
- Athiti
Mira y siente
Cada control deslizante ilustra las características de la marca del cliente y el estilo que debe comunicar el diseño de tu logotipo.