Business Process / Lifecycle Diagram for Consulting Firm
¿Quieres ganar un trabajo como este?
Este cliente recibió 76 diseños de infográficos de 11 diseñadores. Eligieron este diseño infográfico de pb como el diseño ganador.
Únete gratis Encuentra trabajos de diseño- Garantía
-
 US$190
-
 76 diseños
-
 11 diseñadores
Resumen de Diseño Infográfico
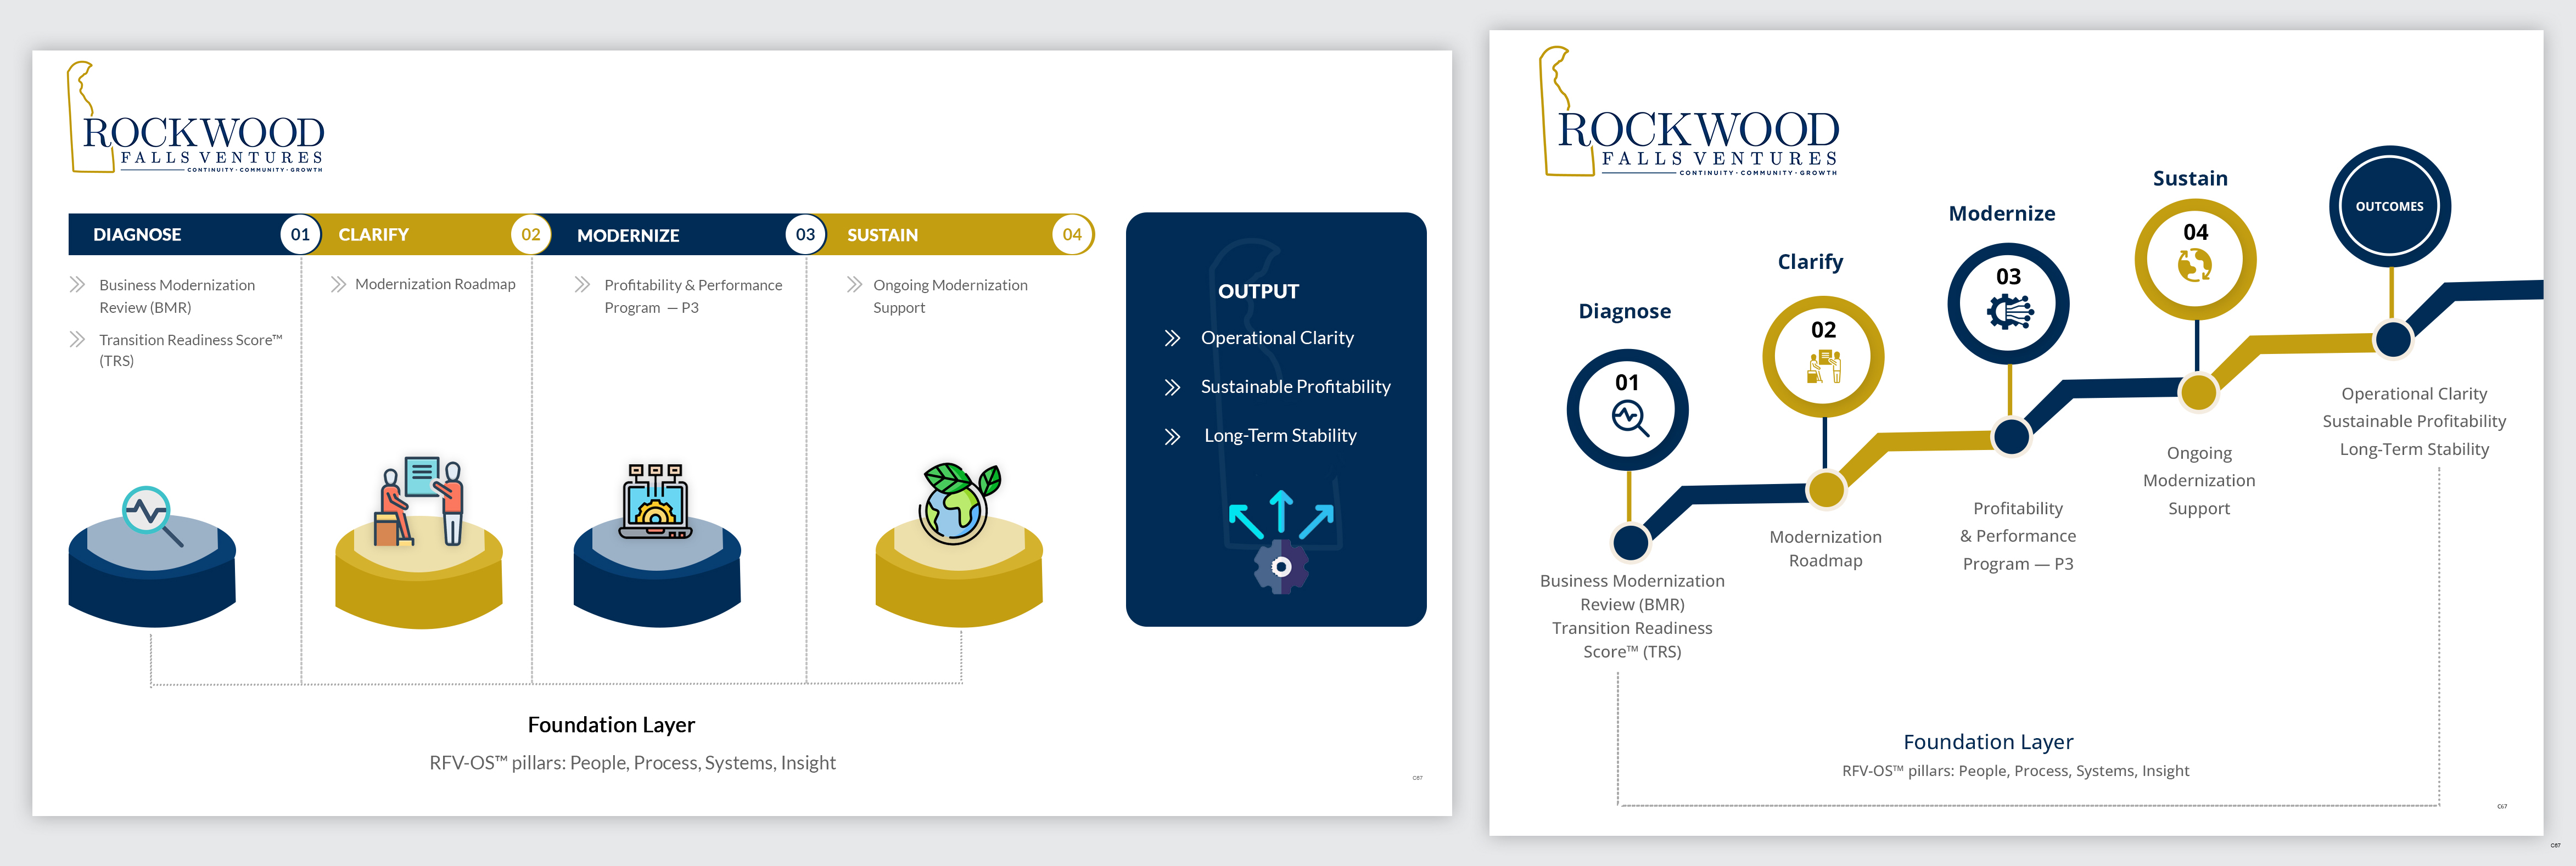
We are a Delaware-based business modernization and transition-readiness firm. We need a clean, professional process diagram that visually represents our client lifecycle. This is not a marketing funnel or sales graphic — it is a product and delivery lifecycle.
The diagram must be reusable across pitch decks, one-pagers, grant applications, and our website.
Required Structure (must follow exactly)
Stage 1 — Diagnose
Business Modernization Review (BMR)
Transition Readiness Score™ (TRS)
(Parallel entry points, equal visual weight)
→ Output: Diagnostic Insight & Priority Signals
Stage 2 — Clarify
Modernization Roadmap (Co-Created)
Stage 3 — Modernize
P3 — Profitability & Performance Program
Stage 4 — Sustain
Ongoing Modernization Support
Foundation Layer (supports all stages)
RFV-OS™ pillars: People, Process, Systems, Insight
End Outcome
- Operational Clarity
- Sustainable Profitability
- Long-Term Stability
Design Requirements
- Professional, calm (not startup / SaaS style)
- Minimal text, clear hierarchy
- Horizontal or left-to-right flow preferred
- No funnels, no sales language, no aggressive arrows
- Must be delivered as editable vector (AI, SVG, or Figma)
Brand Notes
- Neutral color palette that complements logo attached (Gold Color Code C39E11, Navy Blue code 002C55)
- One accent color for emphasis
- Clean typography
- Should feel credible to business owners, advisors, and lenders
- See website (https://www.rockwoodfallsventures.com/) and LinkedIn (https://www.rockwoodfallsventures.com/) for additional insight into branding.
What NOT to Do
- Do not rename stages
- Do not combine stages
- Do not add extra steps